
Hospitals and health systems renegotiate payer rates on an ongoing basis.
At any point in the year, thousands of providers may be adjusting their per diems, case rates, and discounts, and each change reshapes the payer and referral market. Those shifts also change the terms of negotiation, often without competing providers knowing for months or even years. Staying ahead means reviewing every change that affects you.
The catch is that you’ll never know which month, so the current practice is a chore:
- Build a report with every payer/code combination for your competitors
- Export and record every single rate in the market
- Track your report against the previous month’s report and look for a rate delta
- Repeat monthly
Our product philosophy at Serif Health is that healthcare pricing can always be easier. Instead of your team manually laboring on your data, the data should work for you. Signal Watch, a new feature in our pricing intelligence platform, monitors your rate reports for you and delivers email notifications when a negotiated rate change happens.
Your Workflow Now Simplified
Whether you are benchmarking peer institutions, planning a site expansion in a new market, or monitoring market conditions ahead of payer contracting season, Signal Watch allows you to be notified when new decision-changing information is available. Here’s how an example of a report for a clinic doing knee replacements in Texas, becomes a dynamic continuous market notification tool in preparation for contracting discussions:
The Peer Service Lines tool allows you to skip compiling the rates yourself and easily see a MS-DRG as a % of CMS. Compared to parsing raw data row-by-row, this is already a major simplification for procedure-based analysis.
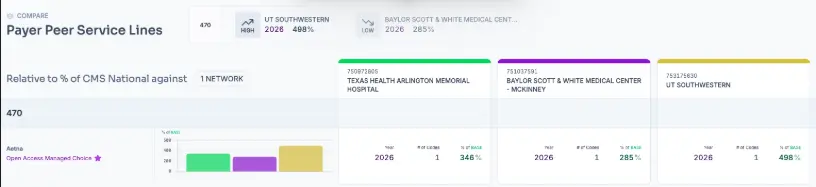
You now have a snapshot view of your market for this past month’s rates. However, the more important questions lie in how much that % of CMS has changed over time. An over-time-view answers several key questions you likely have:
- Have negotiations been successful with this payer?
- Where are health systems moving on their rates?
- What is a reasonable benchmark to consider now?
This is where Signal Watch comes in.
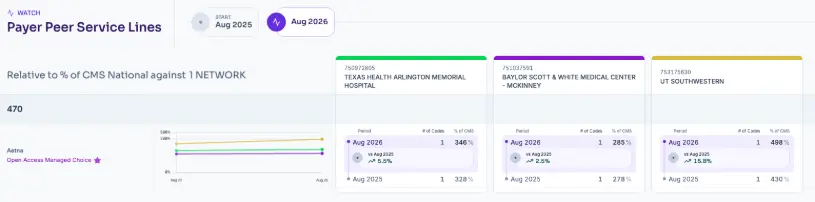
As shown in the screenshot, this particular watch shows results over time for each provider group for MS-DRG 470, along with two things that help you read a movement correctly:
- Visual trending percent of CMS showing how group reimbursement shifts from one period to the next.
- Code count that displays included codes for CMS calculation, so you can tell a broad repricing from a handful of codes moving.
Once you’re happy with your report, the notification feature of Signal Watch will track the report month-over-month and alert you of any movements in the report. With a minute of set-up, this longitudinal visualization can save you hundreds of hours of time building standard rate reports.
The Long View of Service Line Planning
The utility here goes beyond rate benchmarking for a single code. Say you are a California hospital and want to know how large health systems are pricing imaging. The report below rolls up Imaging & Radiology codes for three organizations under Aetna's Open Access Managed Choice network: Sutter Medical Foundation, Stanford Health Care, and UCSF Medical Center.

At a glance, the three sit within a reasonable range of each other, between 358% and 451% of CMS. The historical view in Signal Watch tells a different story.
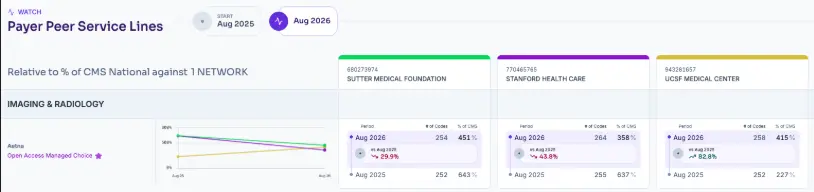
In August 2025, the spread was far wider. Sutter and Stanford were both above 630% of CMS, while UCSF sat at 227%. By August 2026, UCSF's percent of CMS had risen 83%, while Sutter's fell 30% and Stanford's fell 44%. Stanford now sits below UCSF. Code counts held steady across both periods, so the movement reflects a real repricing movement and comparing apples-to-apples.
For a provider priced where UCSF was in 2025, that history makes the case for a higher rate, since peers in the same network were paid nearly three times as much for the same services. For Sutter and Stanford, it serves as an early warning. A premium of roughly 400 points over UCSF largely disappeared in a single year, and the payer is likely to raise that at the next negotiation.
The Bigger Deal
The two examples above follow a specific set of providers for a code or within a single service line, but a watch can be as broad or as narrow as the question calls for.
If you are tracking a wider market, you can start from a service category such as anesthesia or imaging, or from all CPT codes, and filter by state to focus on how large health systems perform in your region. If your concern is how a particular payer treats your peers, you can choose from any of our available payer networks and follow a shortlist of large health systems across specific codes or service categories.
Most teams will find they have more than one question worth tracking. Each watch is set up around a single question and reports back independently, so a contracting team can monitor a competitor's imaging rates, a payer's anesthesia rates, and a statewide DRG trend at the same time without rebuilding any of them.
Conclusion
Healthcare pricing has evolved to the point where having complete rate data is just a starting point. Getting that data to tell you when something moved, without having to remember where or how to go look, is where Serif is turning our comprehensive library into answers.
Signal Watch is available today for payer and hospital reports, with more modes to come, which are included for all of our Signal platform users.
If you’re interested in learning more about the Serif platform and getting access to these tools, feel free to use this link to speak to our team and get access.
For a more detailed view on how Signal Watch works, here’s an article and video to help illustrate its use.