
Three Different Datasets
When we talk about the data we work with at Serif Health, it’s easy to assume all the newly available data works together. In reality, hospital files, payer files, and claims each reveal different parts of the story–each with unique advantages, disadvantages, and blind spots.
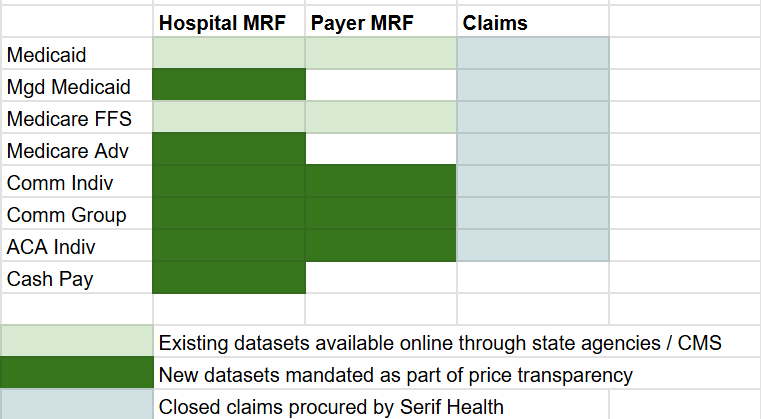
At Serif Health, we think about transparency data as three distinct data assets:
- Payer Transparency in Coverage (TiC) machine-readable-files (MRFs)
- Updated monthly
- Contain allowed amounts for commercial plans
- Missing: Medicare Advantage, Managed Medicaid, Workers Comp, and ASCs/clinician groups are not always complete
- Hospital Transparency (HPT) machine-readable-files (MRFs)
- Contain all negotiated rates by line of business
- Include cash-pay rates
- Only include hospital settings (no physician groups, imaging centers, ASCs)
- Claims
- Provide real-world utilization and payment patterns
- Reveal bundling rules, implants, carve-outs
- Depending on the claim type analyzed, you often get full payment details or full provider details, but not both.
Even though all of these overlap in some places, these data assets are complementary.
For example, by payer typer, the picture looks like a grid below with the Payer MRFs largely missing details around non-commercial / exchange insurance products whereas the Hospital MRFs contain data across payer types(including cash pay!) but only for hospital services.
To fill these gaps, claims are helpful but they generally have significant data lag and are not fully transparent. Usually, if you license a claims dataset from a clearinghouse or 3rd party, you have to choose between seeing the provider’s details (e.g., name, specialty, npi, utilization, etc.) or seeing the payment details (e.g., the paid amounts, allowed amounts, etc.).
Transparency data (the hospital and payer files), as the name suggests, fully identifies everything (e.g., includes the npi, ein, payment details) but does not contain any information on volumes, utilization, or referral patterns / care pathways. So, to pull together a complete picture, all three datasets are important.
A real-world example where this comes into action is dealing with percent of billed charges arrangements.
Percent of Charges: The Easiest Rate to Misinterpret
Let’s say you are an employer using UMR, UnitedHealthcare’s third-party administrator, and you want to know how cost-effective of a hospital ‘Ashley Regional Medical Center’ is in Utah by indexing their cost for a knee surgery (CPT 27447) against Medicare.
First, the payer files:
You want to make sure you are pulling against the most recent data so you go to the payer TiC files which update monthly. You put in 27447 and all you see is a contract for a 77.7% of charges:
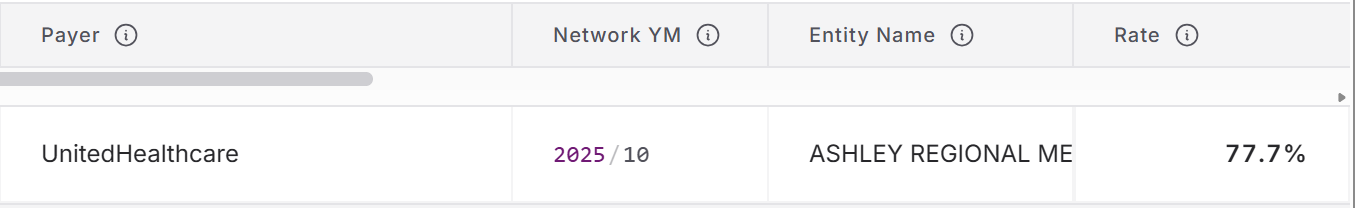
This tells you nothing about the relative cost of ‘Ashley Regional’ because you do not know which dollar amounts ‘77% of charges’ translates to. Hospitals set their own chargemasters so Ashley Regional may charge $5,000 for the procedure when another hospital in the area may charge $2,000. If the other hospital has a 90% of charges contract, that is still substantially less than Ashley Regional!
If you only have access to the payer TiC files, you are stuck. Luckily though, the Hospital Price Transparency act requires Ashley Regional disclose their standard charges by procedure.
Next, the hospital files:
Looking at what Ashley Regional publishes, you can see their standard charges by procedure–e.g., for CPT 27447 (knee surgery), their standard gross charge is $45,349.58 and the methodology even confirms what UHC posted that their contract allows them 77% of charges:
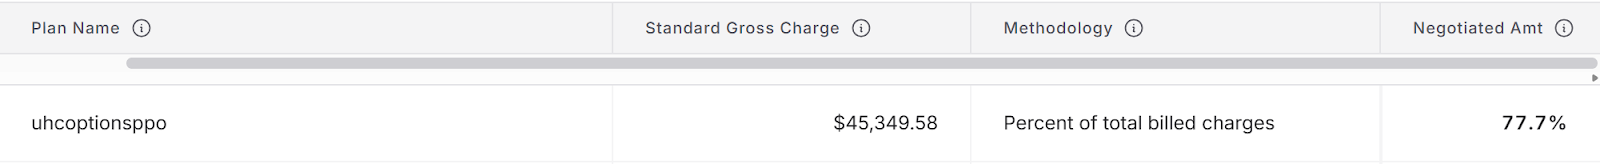
Now, we have all the pieces we need to to calculate the cost index -
(A) Payer TiC files - latest percent of charge: 77.7%
(B) Hospital files - standard charge: $45,349.58
$45,349.58 × 77.7% = $35,236.62
If the national hospital outpatient Medicare payment amount is $12,867, $35,000 is ~275% of CMS.
This insight is not possible without combining hospital and payer price transparency data.
But where do claims come in?
Where Claims Become Critical: Pass-Throughs & Implants
With joint replacements, many hospitals also negotiate a separate pass-through provision for the actual implants used. Without factoring these in, the data may present an incomplete picture of the cost of the procedure. For this example, we will switch gears from Ashley Regional Medical Center and look at the Texas market.
BCBS Texas Blue Choice PPO publishes the following rates for DRG 470 (total hip replacement inpatient):
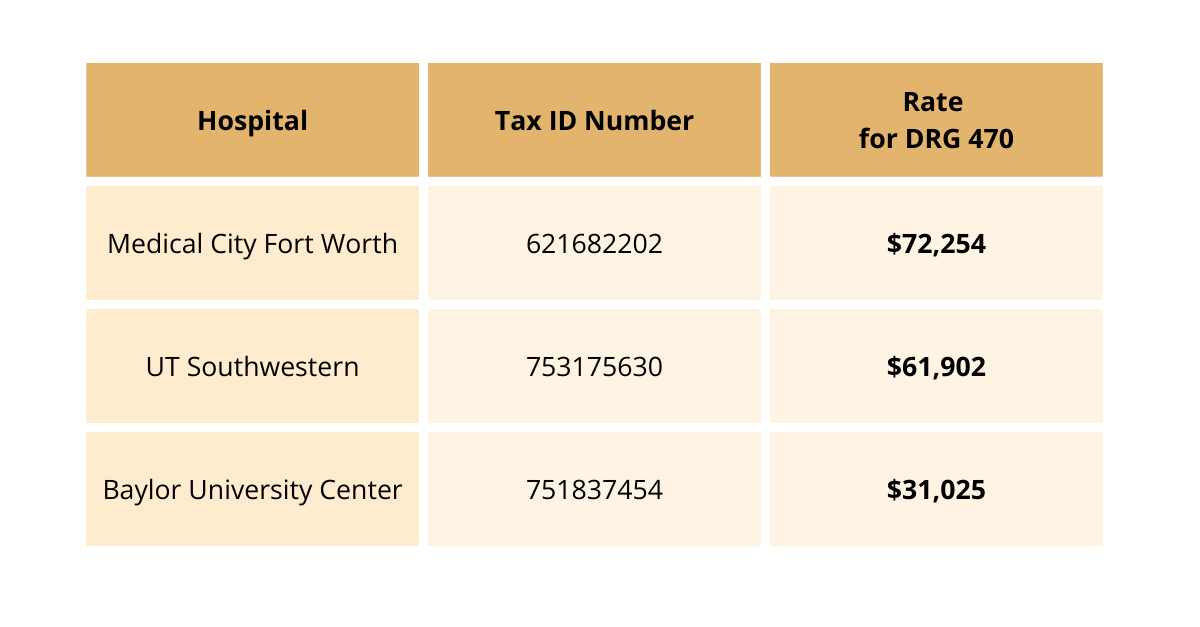
Why does Baylor—one of the largest health systems in TX—have rates ~2x+ lower than their peers?
The answer lies in claims and pass-through provisions for carve-outs.
Pass-through provisions for implants more than covers this apparent delta between Baylor and other health systems; but you need claims to get the bundling logic. Once you overlay implant costs visible in claims:
.png)
After accounting for implants, Baylor is actually similar in cost to peers where the transparency data alone would maybe steer you to believe they are way less expensive. Now we can easily see:
- Baylor’s true cost
- Transparency-only methods understate total reimbursement
- Employers and advisors may mistakenly believe Baylor is lower cost
The Solution: Combining Payer, Hospital, and Claims Data
The power of data lies in the join. To see a complete picture, you need a vendor that compiles and synthesizes data across all three data sets: claims, hospital price transparency files, and payer transparency files.
Each dataset alone is incomplete:
- Payer files show formulas (e.g., “77.7% of charges”) but not the inputs
- Hospital files show the inputs but not the real payment behavior
- Claims show reality but lack universal transparency
You only see the full picture when you synthesize all three. This is exactly what Serif Health does.
We connect:
- The contract logic in payer TiC files
- The standard charges in hospital MRFs
- And the real-world payment patterns in claims
…so employers, TPAs, advisors, and health systems can finally understand true market cost.
Percent-of-charges is just one example—but it’s one of the clearest illustrations of why transparency does not equal clarity unless you know how the pieces fit together.
If you’re curious about how Serif is joining these datasets to power analytics for hundreds of organizations, reach out at hello@serifhealth.com.