

Out-of-network (OON) pricing is where reimbursement policy, contracting and claims adjudication, and consumer protection collide.
The No Surprises Act curtailed balance billing in many common scenarios and created the federal Independent Dispute Resolution (IDR) process for payment disputes. In practice, IDR has become a high‑volume payment system, large enough that CMS now publishes recurring public reporting on dispute volumes and processing outcomes.
At the same time, the Transparency in Coverage (TiC) regulations continue to require commercial payers to publish machine‑readable files (MRFs) that include not only in‑network negotiated rates, but also an OON allowed amount file that reports historical allowed amounts and billed charges. Importantly though, the OON file is subject to claims-volume limitations and other payer-specific implementation choices, so absence of volume in the public file cannot always be interpreted as absence of OON utilization. In particular, we see major national payers like Cigna posting OON allowed amount files that are frequently labeled “empty,” even though it is implausible that these plans have zero OON billing, which strongly suggests the public OON files are materially incomplete and should not be treated as a full census of OON dollars. As we discuss more below, big changes are expected to the OON data requirements next year that will substantially improve OON data reporting.
In this analytical blog, the second in our new, ongoing TiC Takes series, we utilize Serif Health’s comprehensive national Transparency-in-Coverage (TiC) data to examine what’s inside those OON files today, with a simple starting question:
What is actually being reported in payer OON allowed amount files, and what does it imply about where OON dollars show up by service line, payer, and market?
Trends in OON Data Reporting, October 2025 to Present
Out-of-network care occurs when an insured patient receives services from a provider their insurer has not contracted with, which makes pricing less predictable and has historically exposed patients to balance billing or “surprise” bills, compared to in-network care where providers are under contract and prices are typically set in advance (often at a lower, in-network rate). Two aspects of the OON data reported by payers can be further clarified.
1) OON data files reflect lagged data
Unlike the in-network rates data we source and enrich, the OON file is not a real‑time feed. Each file reflects a lagged historical window of 90 days: a defined slice of claims experience that is separated from the publication date by months.
So if a payer like Ambetter reports a total $940M in OON allowed amounts in February 2026 reporting, that reflects the payer’s reported OON allowed amounts within the legally required reporting threshold over the historical 90 day window used. This approximately annualizes to a substantial amount of total spending: $940M × (365/90) ≈ $3.8B.
Month‑to‑month comparability is distorted by claim suppression thresholds, seasonality, and uneven service coverage. Regardless, for some payers we are seeing large and widespread reporting of reimbursement for OON services.
We also observe substantial variation in reporting patterns across payers, with some like Ambetter updating files every month, others like Alliant appearing to report quarterly, and United Healthcare posting an OON file only once in the six month period across several networks.
2) OON data files include both allowed and billed amounts
The OON file reports both allowed amounts and billed amounts. Given the historical non-reporting of these files, many analyzing price transparency data have elected to focus on in-network rates files alone. However, as shown in the figure below, both the allowed amounts paid by payers as well as the billed amounts initially claimed by providers are applicable in many contexts.
Billed amounts are often dismissed as chargemaster noise, but in this context, they serve a different purpose: a publicly available, payer‑reported view of the charged‑vs‑allowed (and denied) gap for OON services. Overall across our OON data where reported, allowed amounts average approximately one third of billed amounts.
Billed and allowed amount differences are particularly high for some key service lines and payers, as we’ll see below.
What Services Lines Show Up in OON files?
A next practical question for anyone trying to use TiC OON files for market intelligence: are we seeing a broad cross‑section of services, or a thin sliver? The chart below shows where out-of-network (OON) dollar volume is showing up by service line, in terms of totals across the “allowed” vs “billed” fields. Considering both these fields provides useful context on billing and adjudication dynamics across different types of services.
Inpatient DRG billings dominate the OON file in terms of total reported spending by a wide margin: payers report roughly $1.505B billed against $440M allowed for inpatient DRG episodes in February 2026 MRFs (our last full month of data when this blog was written). That ~3.4x billed-to-allowed spread is directionally consistent with what you’d expect when “charges” (billed) are far above the amount plans recognize for payment (allowed), and underscores why inpatient OON billing is both financially material and politically charged.
After inpatient DRGs, the next biggest service line is ambulance/transportation, with $569M billed and $355M allowed (a smaller, but still substantial, ~1.6x spread). Pathology & laboratory and evaluation & management (E/M) also appear as notable contributors (with billed amount totals across payers of $300M and $231M, resp.), and remaining service lines showing some reimbursement signal.
OON Reporting Coverage Varies by Payer and Region
We also see order-of-magnitude differences in reported OON amounts by payer, which likely reflects a mix of both true OON exposure differences and varying interpretation of TiC reporting thresholds and suppression rules.
Ambetter is the clear OON volume leader in our data, reporting about $2.65B billed and $0.94B allowed. Health Net, also a subsidiary of Centene, is a distant second at roughly $35M billed and $356M allowed, which brings the two together to about $2.69B billed and $1.30B allowed combined. After those two, volumes drop off quickly across most payers, with a long tail that likely reflects genuinely smaller plans and limited OON exposure. That said, the thin reporting from several large brands is hard to reconcile with their expected scale, which again points to either non-compliance or a materially narrower interpretation of the TiC volume thresholds for what gets disclosed.
Even with these reporting differences, summarizing OON amounts at the state level across payers shows coherent regional concentration that is directionally consistent with prior OON utilization estimates, suggesting the data contains real utilization signal even if coverage is incomplete. Sizeable OON billed amount volume is driven by a small number of states as shown in the map below, with reported allowed amounts similarly totaling over $50M each in Texas ($652M), Florida ($207M), Georgia ($107M), California ($98M), and Louisiana ($53M).
Allowed vs Billed by Payer and Service Line
The below figure shows total reported OON allowed amounts vs total OON billed charges by payer and service line based on the 2026. Both axes are on a log scale, so equal spacing reflects multiplicative changes (10→100 is the same visual step as 100→1,000), which helps us compare payer–service line totals that span orders of magnitude.
This figure shows how:
- Billed and allowed amounts move together. Across payer–service line observations, billed totals generally track allowed totals closely, which supports treating billed as a useful companion measure of intensity and adjudication dynamics rather than dismissing it as a gross charge only.
- The charged‑vs‑allowed gap is large and persistent. In this sample, billed totals are typically multiple times higher than allowed totals at the payer‑service line level. That’s exactly the kind of spread that becomes economically important in OON disputes, even when patients are protected from balance billing.
A handful of payer‑service line points sit materially off the prevailing relationship with allowed amounts greater than billed amounts, (including payers like for HealthNet, which specialize in behavioral health services and may have different billing practices).
Assessing Completeness
One additional feasibility check for assessing completeness in the OON data is to look at the provider networks payers are actually disclosing in their INN rates data. We can count distinct EINs by procedure code that appear in a payer’s in-network negotiated rate files and compare that to the distinct EINs that show up in the payer’s OON allowed amount file over the same publication period. If the OON file is meaningfully populated, you would generally expect at least some non-trivial share of the contracted footprint to surface on the OON side, especially in service lines where out-of-network care is hard to avoid.
The scatterplot above shows this, with the vertical showing unique in-network EINs and the horizontal axis showing unique OON EINs reported for the same network. For most networks, points cluster high on the y-axis, showing large in-network footprints paired with very little to no reported OON provider activity. Some networks, including those from Ambetter, Molina Healthcare, and several local Blues payers show a higher ratio of reported OON EINs to INN EINs that is more realistic. This view, while not perfectly showing payer compliance with OON reporting requirements, highlights that many OON files are likely materially incomplete while others include more usable data.
The In-Network Decision for Providers
When data is well-reported by a payer, one main practical use of TiC out-of-network reporting is assessing the unit economics of going in- vs. out-of-network for providers. For a given service line, comparing a payer’s typical in-network rates against the payer’s reported OON allowed amounts can help quantify what “going out-of-network” is actually worth in that market, or alternatively how much headroom exists before a given in-network contract becomes unprofitable.
In Highmark’s BCBS PPO, the reported out-of-network allowed amounts are often at or above in-network negotiated rates when comparing the same billing codes, but the pattern differs sharply by billing class and service line. In the professional billing class, the standout is G-code professional services, where median OON allowed amounts run at roughly 328% of in-network rates, while most other professional categories cluster closer to parity (roughly ~100–155%). In the institutional billing class, several service lines also exceed in-network levels, including imaging/radiology (156%), pathology & laboratory (146%), and outpatient surgical bundles (144%), while a few categories sit near or below in-network (e.g., surgery at 91%).
Interpreted carefully, these types of comparisons support three common decisions that matter to healthcare finance teams during contracting discussions: 1) whether contracting improves net revenue considering both rates and patient volume, 2) how aggressive to be on rate negotiations by payer across a provide group’s sites of care, and 3) where to prioritize new contracting efforts, deprioritizing a given negotiation when a payer’s OON allowed amounts already approximate in-network pricing.
Within Highmark's data as well as other payers reporting sufficient volume, we're also able to observe some providers losing in-network status over time, with mixed impacts. For example, the Institute for Dermopathology (EIN 1821060641) was last observed with an in-network rate pathology code 88305 for this network of $78.26, compared to a reported median allowed amount value of $38.52; conversely, the Gastroenterology Clinic and Endoscopy Center (EIN 1952497117) was last observed with an in-network rate for 88305 in May 2025 with an in-network rate of $77.95, compared to a reported median OON allowed amount value of $93.
Similarly, Ambetter’s out-of-network (OON) data shows substantially higher reimbursement levels than its in-network rates among EINs that were previously reported in the in-network data: for Evaluation & Management services, OON allowed amounts are typically about 8× the median negotiated in-network rate, with many observations ranging roughly 4× to more than 20× the in-network rate.
Review of Highmark, Ambetter, and other payers’ rates and allowed amounts shows going in-network may not always be in a provider’s financial interest. OON billing strategies themselves also increasingly vary. In particular, some of these numbers may reflect that providers can now dispute claims for out-of-network services through IDRs, an arbitration process introduced under the No Surprises Act.
Why OON Billing Increasingly Matters
In combination, the No Surprises Act and expanding price transparency regulations suggest that both OON billing and utilization of OON allowed amount data will increasingly matter in the years ahead.
No Surprises Act and new reforms: the pressure remains
Even with patient protections introduced under the No Surprise Act, OON reimbursement in many markets remains highly contested. The IDR process is now an operational pathway in the market for many providers, not a niche exception for specific claims. In fact, over $300 billion in total IDR payments were made in the last quarter of 2024, according to the NIskanen Center.
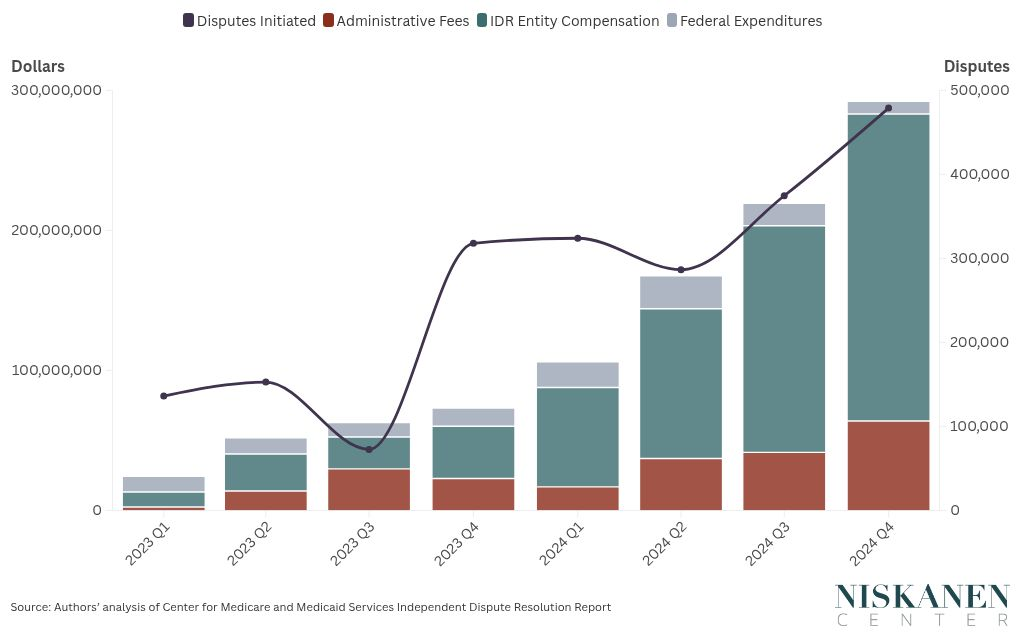
As the Center’s graph above makes clear using CMS IDR release of No Surprises Act reports, over 500,000 disputes occurred last year with both out-of-network utilization and subsequent claims disputes becoming more and more common.
TiC today vs “TiC 3.0” (if proposed rules are finalized)
TiC has matured in the just released 2.0 schema through technical guidance and schema updates. The next meaningful leap, currently undergoing final rulemaking, further reflects a major expansion in the scope and usability of OON amount MRFs.
CMS and the Departments have proposed changes that would make the OON allowed amount file materially more valuable for analytics, including:
- More complete OON coverage (via changes to suppression/threshold rules)
- Longer reporting windows / expanded history (larger sample sizes and more stable measurement)
- More contextual metadata (to enable better stratification and comparability)
- Reduced publication frequency (e.g., quarterly) paired with requirements intended to improve standardization and reduce duplicative noise
Whether every element is finalized exactly as proposed is still TBD, but directionally, the proposals push toward more complete reporting and more consistent comparability across service lines, payer networks, and geographic markets, which is precisely what the OON data available today needs. In particular, 2027 data should allow additional applications to lower-volume services and providers and may skew many of current trends in reporting. For more on our thoughts here, see our public comments to CMS on the proposed rule.
It’s clear that considering enriched TiC data for these questions, relative to claims data or aggregate public reporting, is impactful as a tool for analysis and decision making specifically. While the focus of Serif Health has been on in-network rates data, collection and analysis of the OON files shows value in these files as well. In practice, we’re already working with some customers to evaluate specific providers and service lines to understand how OON reimbursement trends across payers today, with TiC 3.0 hopefully making that type of analysis more consistent and scalable across all payers and markets.
Bottom line: even with uneven payer reporting and coverage today, TiC OON allowed amount files already contain useful information on where OON dollars concentrate and what “out-of-network economics” look like in many markets, with TiC 3.0 likely to further amplify these signals for reliable use in contracting, network design, and patient access.
About Serif Health
At Serif Health, our focus is to turn every transparency disclosure into reliable, comparable reimbursement intelligence so teams can make decisions with confidence. We’ll continue to publish insights on our blog and highlight how payer rates data shows up in live MRFs via our payer inventory.
If you’re interested in applying price transparency data, we’d love to connect. Please reach out to hello@serifhealth.com or schedule a demo. Also feel free to check out our sample data on our web platform Signal.
Technical notes
- Publication month vs incurred period: The network_year_month in OON data represents the payer’s publication month; each file reflects a lagged historical reporting window.
- Codes not mapped to a Serif Health service line included overall but excluded from service-line specific views.
- Additional, unstructured data sourced by Serif Health but not mapped to an individual payer network is excluded from overall results. All other payers with posted OON files were considered, unless otherwise noted in specific analysis/figure footnotes.