
.webp)
Florida Blue’s machine-readable files are large, and—like many payer disclosures—gappy and uneven in coverage over time. We’ve written before about the shape of these gaps, including the “Swiss cheese” nature of Florida Blue’s disclosures and the operational realities of processing evolving TiC files over time.
One recurring question we had that followed from that work: can time fix this?
In other words: If we accumulate everything Florida Blue has published over the last N months, do the missing pieces fill in?
We decided to test that directly.
The Hypothesis: Time as a Gap-Filler
At a high level, the idea is straightforward. Individual monthly MRFs often look incomplete: EINs appear and disappear, negotiated rates are present for some facilities but missing for others, and network membership shifts in ways that are hard to interpret from a single snapshot.
Our hypothesis was that these gaps might be largely temporal artifacts, perhaps due to MRFs being generated off of real-world claims volumes or some other stochastic behavior. If that were true, accumulating disclosures across a longer window—12 months, 18 months, or more—should recover most of the missing signal and yield something close to a complete Florida Blue MRF.
So we built exactly that: Smash together Florida Blue MRFs spanning recent history over the past 18 months, and then evaluate coverage at the EIN level. Helpfully, our ingestion process automatically deduplicates records and eliminates zombie rates as part of the transform, so counts in the aggregate network will only reflect net-new useful and usable information.
What the Data Shows
The short answer: accumulation helps—but it does not solve the problem.
When we accumulate Florida Blue postings across time, overall coverage improves. Here’s the data for Options PPO 202511 vs. aggregated, with a BCBS Texas PPO thrown in there as a ‘control’ of sorts, since it’s a generally good MRF posting (solid coverage and accuracy metrics) from a Blue entity that has a similar-in-magnitude covered population and geographic size.
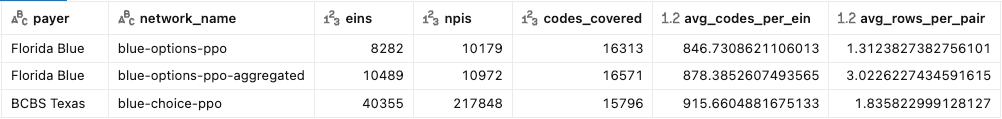
Comparing rows 1 and 2, we see:
- More distinct EINs and NPIs represented in the aggregate than in the latest single monthly file - a ~23% bump in EINs is exciting!
- A slight bump in distinct codes covered both across the file and per EIN
- A substantial increase in records per EIN / code pair from 1.3 to 3.0
All good, right? Well, no.
That last bullet isn’t actually a good thing. One of the analytic powers MRF data changes through time should give us is the ability to see when contracted rates change, and to be able to calculate deltas per-entity and per network that represent changes in overall ‘expensiveness’ of services. When you converge postings through time like this, you’re artificially boosting your coverage by trading off clarity and creating ambiguity about what the ‘right’ rate is for a given provider / code tuple.
Further, when we compare the aggregated network stats to our BCBS of Texas network, we see that we are still miles away from a ‘reasonable’ EIN or NPI count for a state-wide PPO, and indeed have totally overshot on the rows per pair metric that indicates ambiguity.
The Unhelpful EIN Coverage Bump
Now to answer the question of whether the 23% bump in EINs from our aggregation approach fixed the effective gaps in the data for entities of concern. Spoiler: Nope.
We pointed out in our earlier blogs that MRFs from the very early days of Florida Blue’s posting history had a different data density; while they were still undersized and gappy, they tended to contain data for EINs of interest where recent postings did not. The last instance of that posting structure was all the way back in August of 2023. Let’s rerun our earlier query with that MRF included to compare its metrics (I appended the year month to the network_name field for clarity):
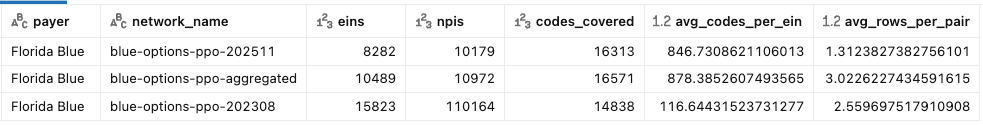
This makes it clear that aggregation doesn’t come close to restoring the fidelity of those earlier 202308 postings.
More practically, when we test the incidence rate of specific EINs’ in these three different MRF sets we learn that many of the EINs that matter most to our customers remain missing or only partially represented, even after accumulating 18 months of disclosures.
We recently had four different in-network Florida provider groups ask us to retrieve their PPO rates. Only one of those searches returned results in the most recent posting. Let’s repeat that same exercise across our varieties of Florida Blue PPO with the following query:
select payer,
  network_name,
   count(*) as row_count,
   count(distinct ein) as eins
 from main.rates.enriched_rates where
  network_id IN (...three uuids I will spare your eyeballs...)
  and ein IN (...four customer EINs, redacted for privacy...)
  and code_type != 'NDC'
 group by network_name, payer
 order by eins
The result:
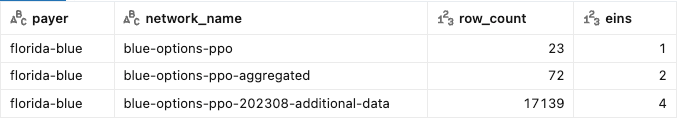
Clearly, there is some practical benefit to aggregation, but not as much as using a more complete posting.
In case you’re worried the set of client EINs we are testing here are biased or cherrypicked (or you’re really really excited to try this at home), here’s the same query for a set of EINs for some of the largest health systems in Florida.
select payer, network_name,
   count(*) as row_count,
   count(distinct ein) as eins
from main.rates.enriched_rates where
 network_id IN  (...eliding UUIDs...)
 and ein IN (
   '590724459', -- AdventHealth Orlando
   '591726273', -- Orlando Health
   '593140335', -- Baycare
   '590747311', -- Baptist Jax
   '591525468', -- HCA West
   '591713947', -- Jackson Health System
   '596012065', -- Broward
   '590714812'  -- Lee Memorial
 )
 and code_type != 'NDC'
 group by payer, network_name, network_id
 order by eins desc, payer, network_name
We can even spice this up by adding in Aetna and UHC national products, just to make sure we’re not picking EINs or systems who might not contract commercially. The results:
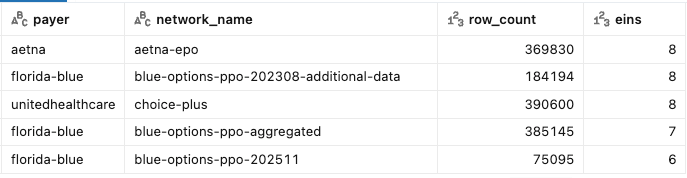
Again, we see that accumulation gets the row count up—but it does not reconstruct a complete or stable Florida Blue file.
Why This Matters
For exploratory analysis, aggregate networks can be useful. They increase recall and provide a better sense of where Florida Blue has ever disclosed rates.
But for production use cases—network analysis, pricing comparisons, contract evaluation, or downstream modeling—missing or unstable EIN coverage is still a real issue. Partial visibility can be worse than no visibility if it creates false confidence.
This is especially true when customers care about specific EINs: large health systems, anchor hospitals, or strategically important provider groups. If those EINs are inconsistently disclosed, accumulation alone doesn’t fully address the gap.
Our Approach Going Forward
Based on these findings, we’re adjusting how we handle Florida Blue networks moving into 2026.
Rather than relying on rolling accumulation, we’re maintaining a persistent “lookback” network anchored to August 2023 (202308). This lookback preserves historically disclosed EINs that continue to matter, even when they no longer appear consistently in recent postings.
Practically, this means:
- Customers get coverage for EINs that matter, even if recent files drop them
- Over time analyses can retain meaningful deltas and clarity
- The decision to use historical data (and possibly stale rates) is explicit
This approach doesn’t pretend the data is perfect. Instead, it reflects how the data actually behaves—and gives customers more reliable coverage as a result.
Closing Thoughts
Florida Blue’s disclosures exhibit structural gaps that accumulation over time will not resolve.
By combining our existing networks with a maintained lookback from our historical data library, we aim to maximize coverage where possible while staying honest about what’s missing and intentional about how we handle it.
As always, we’ll keep sharing what we learn—especially when the answer is more complicated than we’d like it to be!