
The Discount Dilemma
For years, network discounts have been treated as a proxy for value in employer-sponsored healthcare. But that’s changing. Many employers now recognize that a deep discount off a highly inflated list price doesn’t guarantee true savings.
This shift matters in everything from selecting TPA partners to evaluating network performance and steerage opportunities. Because billed charges are moveable goalposts, discounts alone don’t actually lower costs—they often obscure them.
Consider this:
- A 60% discount off a $10,000 bill still leaves you with a $4,000 payment.
- A 20% discount off a $3,000 bill results in just $2,400.
.webp)
When contracts are structured as a percentage of billed charges, annual increases in chargemaster rates quietly raise costs. Employers can be left overpaying despite "strong discounts" negotiated by payers.
What Discount-Based Thinking Misses
Before the advent of price transparency regulations, the healthcare ecosystem relied heavily on percent-of-billed-charge arrangements and rough approximations from Uniform Data Specifications (UDS). These estimates made it difficult to assess unit costs or compare provider networks with precision.
Additionally, there has been greater scrutiny in recent years about the limitations of UDS, as highlighted by both Risk Strategies and Milliman. The good news: with recent healthcare price transparency regulations, we can finally assess the true impact of these arrangements.
Thanks to the Hospital Price Transparency Rule and Transparency in Coverage Final Rule, employers now have access to actual negotiated rate data — and the insights are striking.
At Serif Health, we analyzed 2025 machine-readable files (MRFs) and found:
- In systems like Baptist Health South Florida, Hospital Sisters Health System, and Novant Health, percent-of-billed charge contracts were more expensive than fixed fee schedules in over 50% of cases for certain payers
- In some cases, the disparity for a given health system and network exceeded 70% of cases reviewed
- In DRG-level matched analyses, some percent-of-billed arrangements implied $150,000 to $300,000+ in overpayment per case
- As of 2025, roughly 1 in 5 commercial hospital rates are still tied to percent-of-billed-charge structures
What Employers Can Influence
So, what can self-funded employers do if they’re not the ones negotiating directly with hospitals?
A lot, actually.
Employers influence cost exposure by:
- Choosing TPAs or networks with better unit cost profiles
- Carving out service lines (e.g., MSK, oncology, dialysis) where alternative vendors may outperform on cost and quality
- Designing tiered or narrow networks based on negotiated rate intelligence
Transparency data enables employers to assess networks and TPAs with far more precision than historical discount analyses alone. Employers can compare unit prices, steer to more cost-effective providers, and require specific discount guarantees or reimbursement structures in key regions.
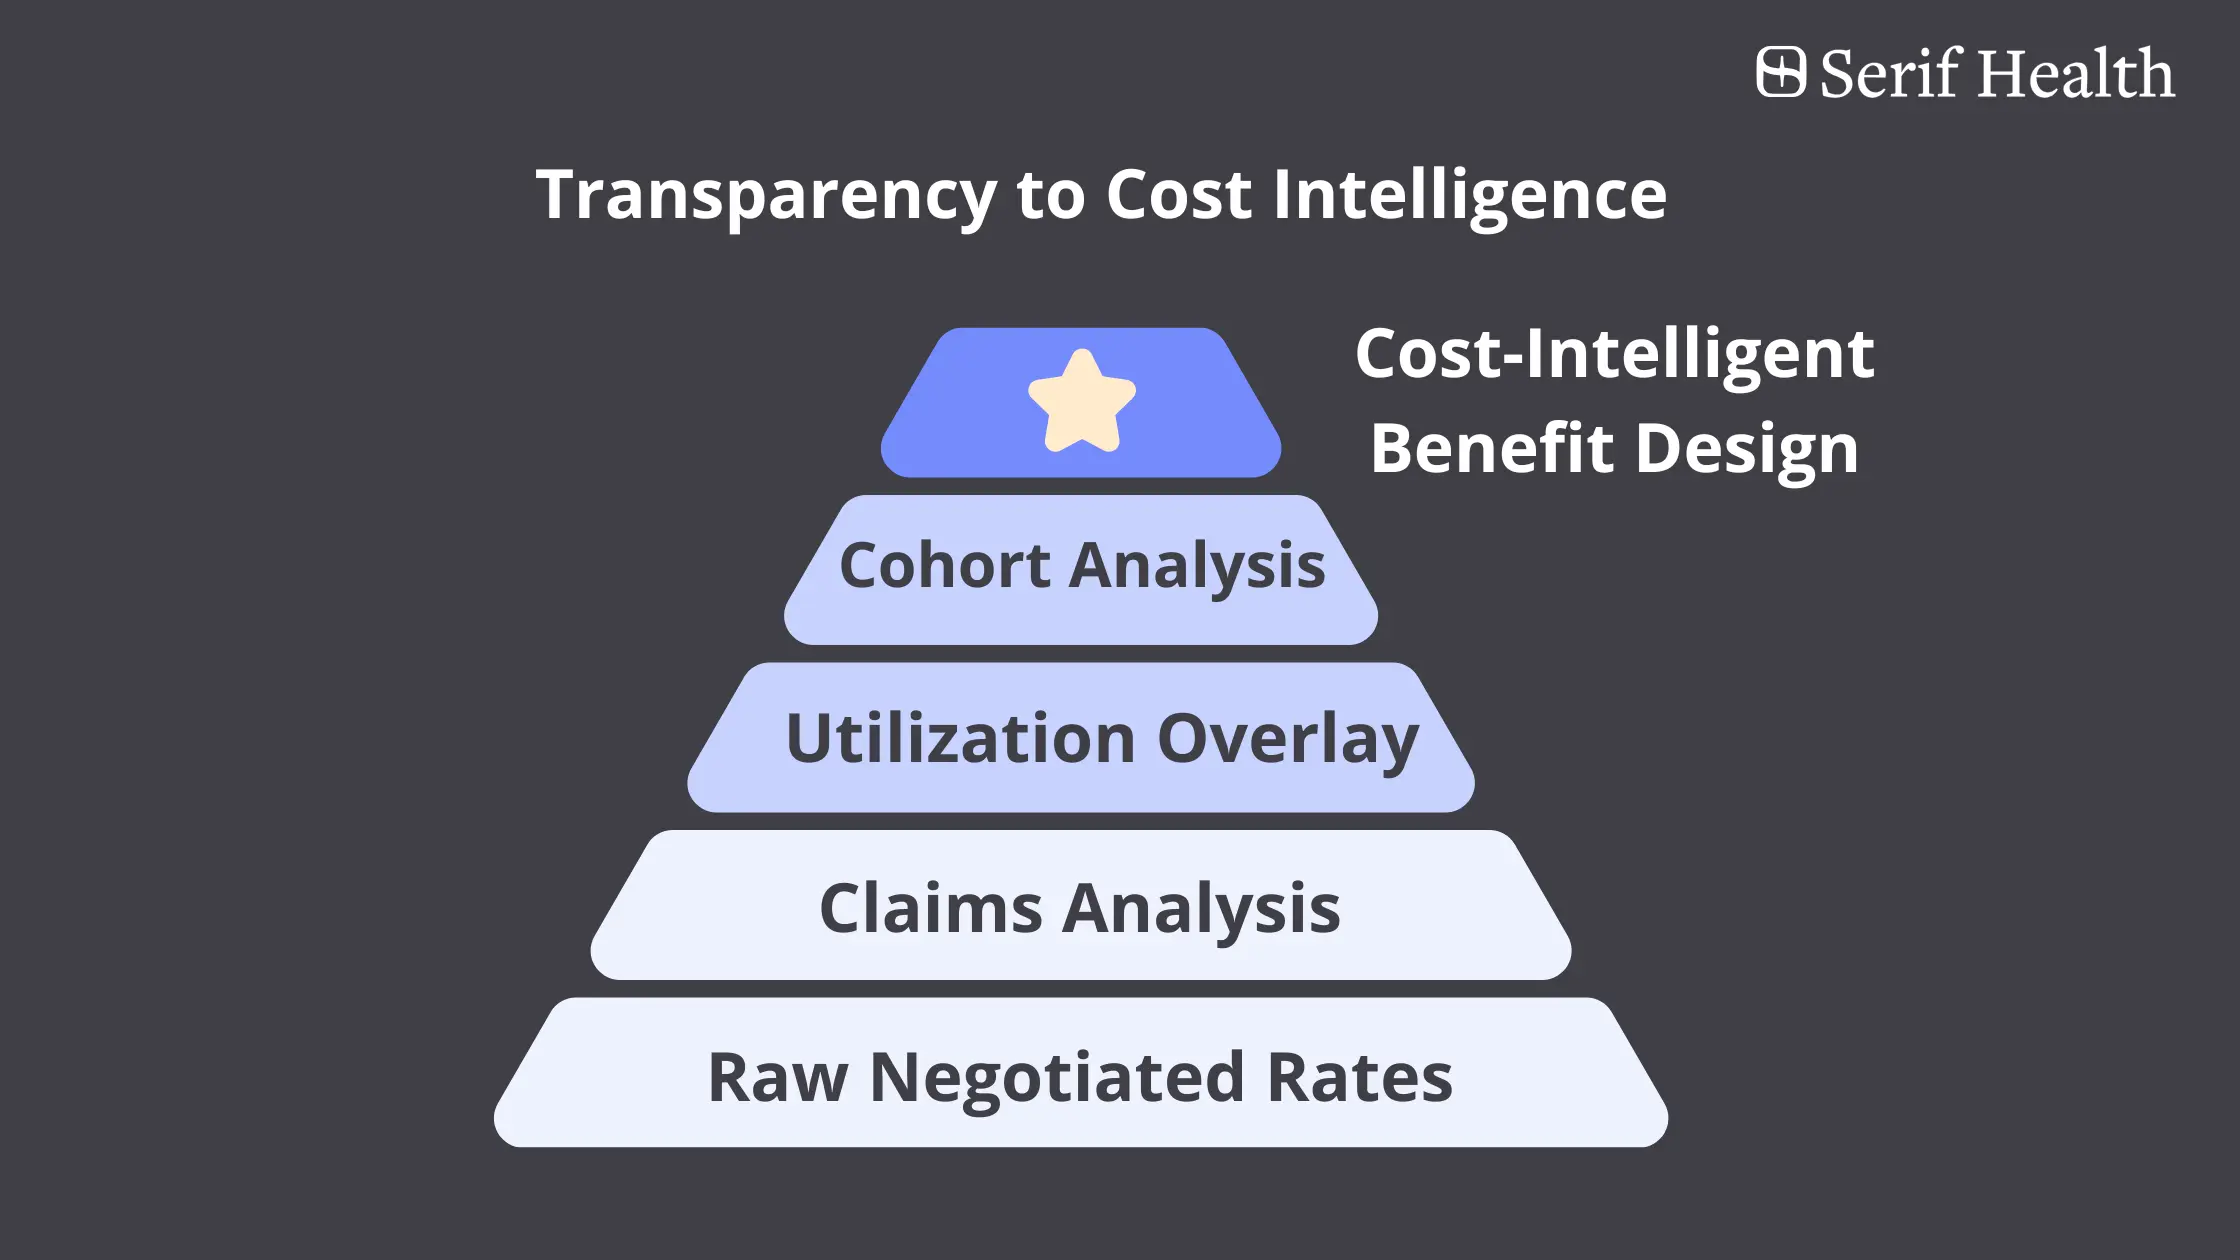
From Price Transparency to Cost Intelligence
Access to rate data is just step one. What actually drives savings is cost intelligence — the ability to contextualize pricing with real-world utilization patterns and population needs.
At Serif Health, we combine:
- Price transparency data (negotiated payer rates)
- Claims-derived utilization patterns
- Employee census inputs (age, location, gender)
- Geography- and service line-specific analysis
This powers:
- Payer network benchmarking using market-based cost scoring
- Unit cost assessment across payers, networks, and providers
- Service line cost profiling (e.g., cardiology, MSK, maternity) for carveout analysis
- Forecasting of total cost of care based on your actual population
This is how employers move from theoretical savings to accountable, data-driven decisions.
Beyond Unit Prices: Why Total Cost of Care Matters
It’s tempting to chase the lowest sticker price—a $600 MRI or a $2,000 colonoscopy. But without understanding how often those services are used, employers risk optimizing for the wrong metric.
Serif overlays price transparency data with claims-based utilization by code and population, enabling benefits teams to:
- Forecast total cost of care by region, provider, or employee cohort
- Compare networks and vendors based on expected spend
- Steer members to providers who deliver both value and quality
The result? The best of both worlds: current, contract-specific pricing data, combined with real-world utilization intelligence to support smarter plan design and vendor decisions.
Final Thought: Discounts Gave Us a False Sense of Control
Transparency laws were a breakthrough. But they were step one. Employers don’t need more discount reports. They need actionable intelligence that helps them:
- Choose better TPA and network partners
- Justify carveouts or steerage decisions
- Build high-performing, cost-efficient plans
Ready to Go Beyond Discounts? Let’s Talk.
At Serif Health, we turn price transparency into cost intelligence. If you’re ready to modernize how you evaluate network partners and vendor solutions, we’d love to help.
Reach out: whitney@serifhealth.com