

Executive Summary
Anesthesia billing presents unique challenges in healthcare price transparency. Unlike procedures with straightforward fee schedules, anesthesia reimbursement follows a formula. On top of this, only some elements of the rate formula are posted in price transparency files across payers. This made meaningful rate comparisons between insurance networks nearly impossible — until now.
Serif Health has leveraged sophisticated machine learning techniques to successfully standardize anesthesia rates across major payers, achieving coverage rates between 76% and 89% depending on the payer. This improvement enables true apples-to-apples comparisons of anesthesia pricing, unlocking significant value for healthcare stakeholders navigating a complex reimbursement landscape.
The Challenge
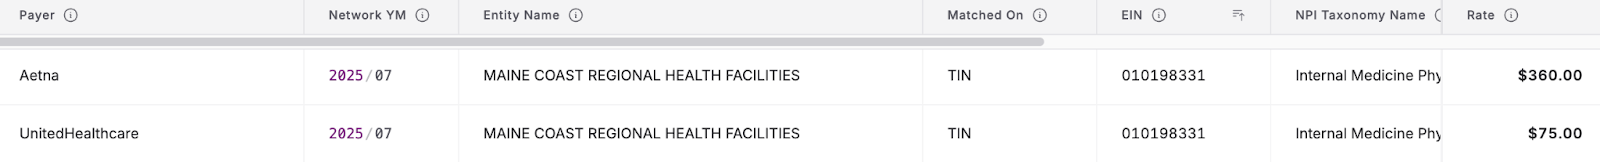
The complexity becomes apparent the moment you start examining machine-readable files (MRFs) from different payers. UnitedHealthcare might report a value of $75 in their MRF for a routine anesthesia procedure, while Aetna shows $360 for the identical procedure code and provider. At first glance, these figures suggest massive reimbursement disparities. But they’re not truly comparable—they represent different components of the same underlying payment formula.
This fundamental comparability problem stems from the anesthesia billing methodology, which calculates reimbursement using a specific formula:
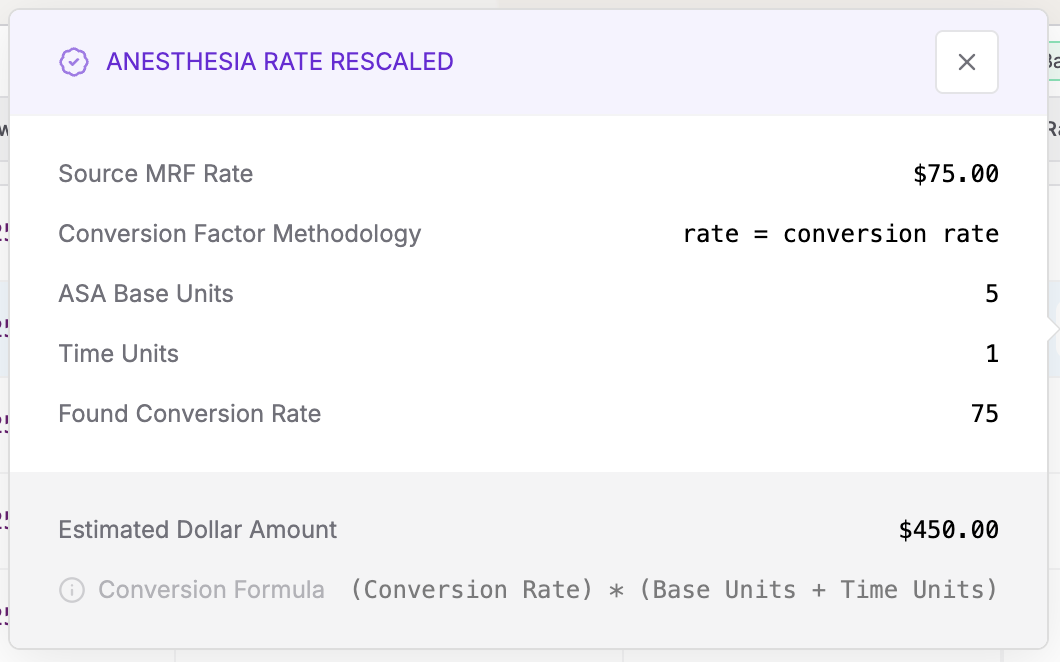
(Base Units + Time Units) × Conversion Factor = Fee Amount
The challenge is that each payer reports different parts of the formula in their transparency files. Some provide the final Fee Amount representing total payment, others report only the Conversion Factor (similar to these used by CMS) as a dollar amount per unit, and many apply different methodologies for calculating Time Units—ranging from 0 to 10+ units depending on procedure duration and payer-specific rounding rules.
Adding another layer of complexity, calculation methods vary not just by payer, but by network and even by individual EIN within the same payer system. This variability renders direct rate comparisons meaningless and obscures true market dynamics, creating a significant blind spot in healthcare price transparency efforts.
Our Solution
At Serif Health, we've developed a proprietary algorithm that systematically reverse-engineers each payer's approach to anesthesia rate reporting. Our methodology involved identifying which calculation component each payer reports in their MRF, understanding how time units are interpreted across different networks, mapping variations across EINs within the same payer system, and identifying network-specific calculation differences that affect final reimbursement.
Time unit calculation variations presented another critical finding. Payers may apply different approaches to calculating time units from actual procedure duration, with some systems allowing 0-10 units while others operate on a 1-10 scale. Increment structures vary in how 15-minute time periods are counted and rounded across different payer systems, and different time unit calculations may apply depending on anesthesia type or complexity.
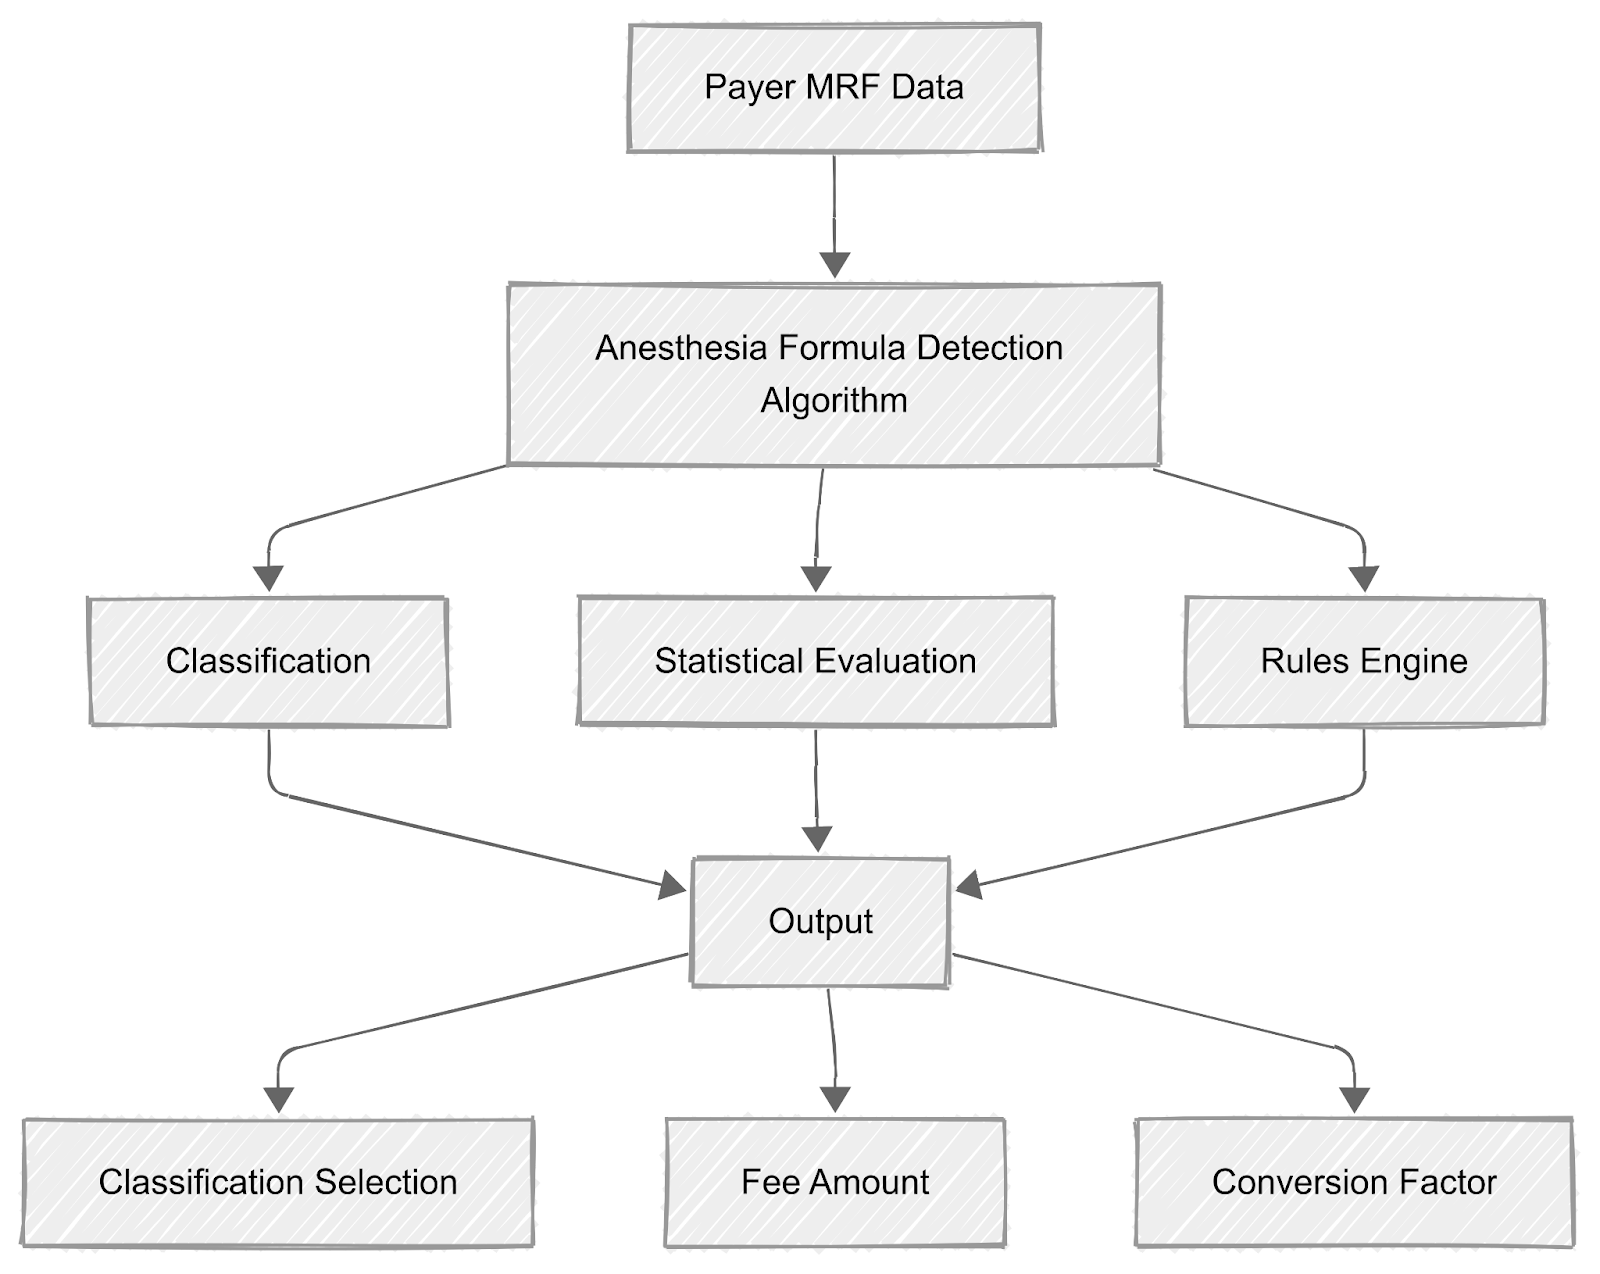
To solve these complexities, our technical approach leverages machine learning techniques to analyze patterns across billions of rate entries. The classification algorithm detects calculation patterns, identifies conversion factors through statistical analysis, maps network-specific variations, and validates results against comprehensive test data.
This process normalizes incomparable raw data into standardized, actionable intelligence that healthcare stakeholders can actually use for decision-making.
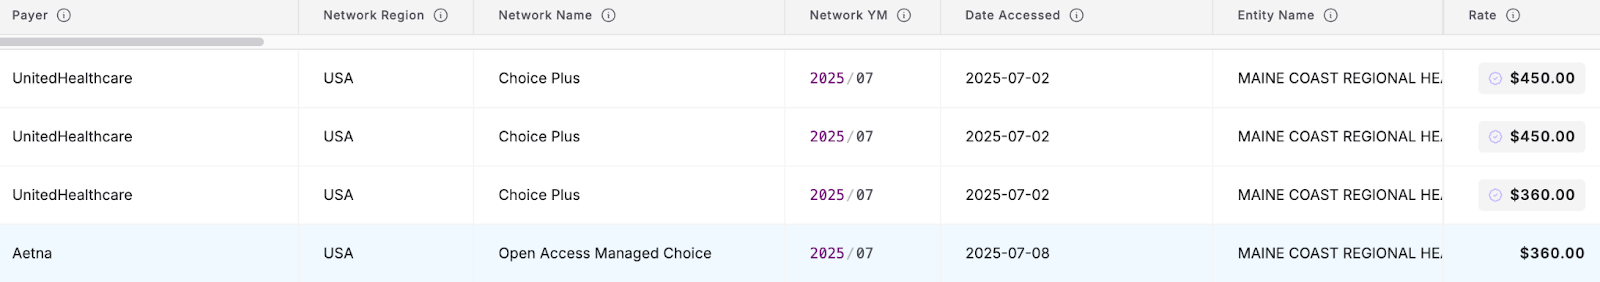
For example, in the screenshot below, Aetna and UnitedHealthcare may show different rates, but next to the UnitedHealthcare rates there are purple checks, indicating these values were translated based on our detection algorithm.
Once a translated rate is clicked, a user can see the explanation for a given value, allowing unprecedented transparency into anesthesia reimbursement. This gives users the confidence to understand—and trust—any translated rate in the Serif system.
Methodology
Our data processing pipeline begins with automated collection and parsing of payer machine-readable files, followed by pattern recognition algorithms that identify calculation signatures. Formula detection uses statistical analysis to determine which component is being reported, leading to standardization by converting all rates to a consistent Fee Amount basis. We validate against an annotated test set of diverse payer records, with ongoing QA and algorithm refinement.
The sophistication of our approach goes beyond simple conversion factors. The system learns from data patterns, adapts to changes in payer reporting methodologies over time, accounts for procedure-specific variations in billing approaches, and maintains accuracy even as payers modify their MRF structures.
Results
Our standardization algorithm has achieved remarkable success rates across major payers, validated through rigorous testing against a test set approaching 100,000 rows of diverse and balanced payer data. The test set includes edge cases and representative data from each payer, with annotations reviewed by our team.
Algorithm Accuracy by Payer:
| Payer | Success Rate | 95% Confidence Interval |
|---|---|---|
| Aetna | 98.86% | [98.71%, 99.01%] |
| Anthem | 84.11% | [83.26%, 84.96%] |
| Cigna Corporation | 99.99% | [99.94%, 100.00%] |
| UnitedHealthcare | 99.00% | [98.84%, 99.16%] |
Overall, the algorithm processed ~2.5 billion anesthesia rate records, representing 84.91% coverage across our dataset.
Coverage Rates by Payer:
| Payer | Coverage Rate |
|---|---|
| Aetna | 80.00% |
| Anthem | 80.00% |
| Cigna Corporation | 76.00% |
| UnitedHealthcare | 89.00% |
Implications for Healthcare Stakeholders
Standardization enables high-confidence estimates of the actual negotiated reimbursement rate per anesthesia treatment—and clarity into how that rate is calculated. Anesthesia practices can now easily use price transparency data to benchmark their negotiated rates against market standards, identify underperforming payer relationships, prepare data-driven contract negotiations, and understand their regional competitive positioning.
Health systems can now evaluate anesthesia providers based on true reimbursement—not misleading or partial rate data. They can optimize anesthesia coverage strategies across different payer mixes and support their anesthesia departments with market-intelligence-driven negotiations.
Payers and TPAs can leverage this intelligence to benchmark their anesthesia reimbursement against industry standards, identify potential areas for network optimization, and ensure competitive positioning in provider recruitment and retention efforts.
Conclusion
This breakthrough in anesthesia rate standardization represents a significant step forward for healthcare price transparency. Through data science and deep domain expertise we have successfully standardized anesthesia rates, with coverage approaching 85% for major payers.
As the healthcare industry moves toward greater transparency, standardized rate comparisons are essential for creating more efficient, equitable markets and better-informed decision-making across the anesthesia ecosystem.